
This web application accompanies a manuscript published in BMC Molecular Medicine: Rade, M., Kreuz, M., Borkowetz, A., Sommer, U., Blumert, C., Füssel, S., Bertram, C., Löffler, D., Otto, D. J., Wöller, L. A., Schimmelpfennig, C., Köhl, U., Gottschling, A. C., Hönscheid, P., Baretton, G. B., Wirth, M., Thomas, C., Horn, F., & Reiche, K. (2024). A reliable transcriptomic risk-score applicable to formalin-fixed paraffin-embedded biopsies improves outcome prediction in localized prostate cancer. Molecular medicine (Cambridge, Mass.), 30(1), 19. https://doi.org/10.1186/s10020-024-00789-9
Background: Clinical manifestation of prostate cancer (PCa) is highly variable. Aggressive tumors require radical treatment, while indolent ones may be suitable for active surveillance or organ-preserving therapies. We have previously developed the prognostic ProstaTrend signature by application of transcriptome‐wide microarray and RNA-sequencing (RNA-Seq) analyses [1]. To transfer the ProstaTrend signature for application in clinical routine, we used a cohort of 176 tumor specimens obtained from formalin-fixed paraffin-embedded (FFPE) biopsies for RNA-Seq.
Methods: Based on the transcriptome data of the FFPE biopsies, we filtered ProstaTrend for genes susceptible to FFPE-associated degradation via regression analysis. ProstaTrend was additionally restricted to genes with concordant prognostic effects in the RNA-Seq TCGA prostate adenocarcinoma (PRAD) cohort to ensure robust and broad applicability. The prognostic relevance of the refined Transcriptomic Risk Score (TRS) was analyzed by Kaplan-Meier curves, Cox-regression models in our FFPE-biopsy cohort and 9 other public datasets with biochemical recurrence (BCR) as primary endpoint. In addition, we developed a prostate single-cell atlas of 41 PCa patients from 5 publicly available studies to analyze gene expression of ProstaTrend genes in different cell compartments.
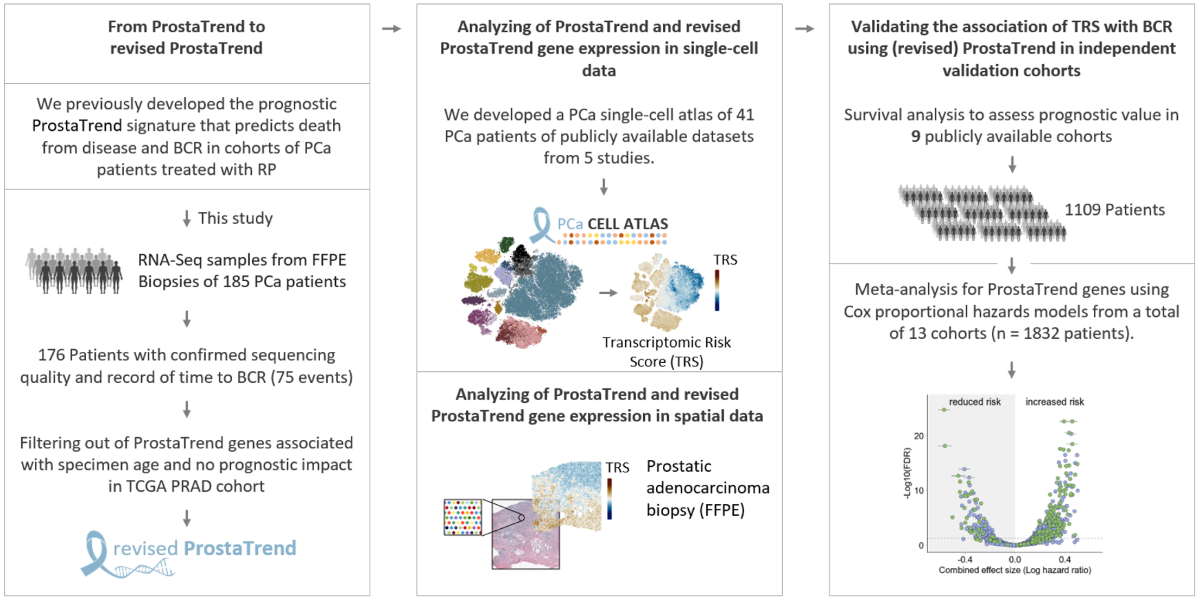
Results: The TRS based on the revised ProstaTrend signature, which included 204 genes, was significantly associated with BCR in the FFPE biopsy cohort (Cox-regression p-value <0.001). The TRS retained prognostic relevance when adjusted for Gleason Score. We confirmed a significant association with BCR in 9 independent cohorts with a total of 1109 PCa patients. Comparison of the prognostic performance of the TRS with 17 other prognostically relevant PCa panels revealed that the revised ProstaTrend was among the best-ranked panels. We generated a PCa cell atlas to associate ProstaTrend genes with cell lineages or cell types. Tumor-specific luminal cells have a significantly higher TRS than luminal cells in all analyzed datasets. In addition, TRS of epithelial and luminal cells was correlated with increased Gleason score in 3 studies.
Conclusion: We developed a prognostic gene-expression signature for PCa that can be applied to FFPE biopsies and is suitable to support clinical decision-making.
[1] Kreuz M, Otto DJ, Fuessel S, et al. ProstaTrend-A Multivariable Prognostic RNA Expression Score for Aggressive Prostate Cancer. Eur Urol. 2020;78(3):452-459.
Meta: P-value: Estimated p-value for the combined effect size using the R package meta .
Meta: P-value adjusted: Adjustment of p-values using the Benjamini-Hochberg correction for multiple testing.
Meta: I²: To assess the amount of heterogeneity post-hoc, the I² statistic was calculated using the meta. package.
logHR consistency: Number of cohorts in which the gene was observed with a consistent logHR.For example, a number of -13 means that the query gene had a logHR < 0 in 13 cohorts.
Univariate random-effect meta-analysis of Cox regression models
The log hazard ratio (logHR) for each cohort is represented by a square.
The confidence interval (CI) is depicted by a horizontal line. The size of the square
corresponds to the weight of the cohort in the meta-analysis. The combined
effect and the CI is represented by a diamond. The between-study heterogeneity
is depicted by the I² statistic. The p-value refers to the heterogeneity statistic Q.
Funnel plot for analysis publication bias
Hazard ratios (logHR) vs. Standar-Error with 95% confidence limits. Each point represents an individual cohort
Survival analysis. Kaplan-Meier curves for patients with standardized gene expression in the respective cohort >0 compared with patients with gene expression in the respective cohort ≤0. The numbers under the cohort IDs indicate the number of patients and cases with BCR. For the FF_array_RP and FF_seq_RP cohorts, the end point death from disease was used. Color shades depict the 95%-CI for Kaplan-Meier curves. Log-rank tests were performed to evaluate probabilities of BCR-free survival or death from disease between the two groups.
Meta: P-value: Estimated p-value for the combined effect size using the R package meta .
Meta: P-value adjusted: Adjustment of p-values using the Benjamini-Hochberg correction for multiple testing.
Meta: I²: To assess the amount of heterogeneity post-hoc, the I² statistic was calculated using the meta. package.
logHR consistency: Number of cohorts in which the gene was observed with a consistent logHR.For example, a number of -13 means that the query gene had a logHR < 0 in 13 cohorts.

Figure is taken from Sanchez-Vega et al. (DOI: 10.1016/j.cell.2018.03.035)
RNA-Seq data of primary tumor and normal specimens from the the Cancer Genome Atlas Project (TCGA). (A) Gene expression level of the selected gene in 34 human cancer subtypes. The numbers in the parentheses indicate the number of primary tumor and normal samples, respectively. Only normal tissue samples with >10 samples were analyzed. (B) Cox proportional hazards regression analysis for selected ProstaTrend genes in each TCGA cancer type. The primary endpoint, with the exception of PRAD, was death from disease. For PRAD, biochemical relapse was used as the primary endpoint. The red points indicate the log hazard ratios (logHR). The 95% Confidence intervals (CI) are depicted by a vertical line. The stars represent the significance: *** = p-value < 0.001, ** = p-value <0.01, * = p-value < 0.05, no star = p-value was not significant (p-value > 0.05). Significance was adjusted for multiple testing using the Benamini-Hochberg method.
RNA-Seq data from human tissues of the Genotype-Tissue Expression (GTEx) project. Gene expression level of the selected gene in 44 human tissue subtypes
Overview of transcriptome datasets analyzed in this study
RP = Radical Prostatectomy; FFPE = Formalin-Fixed, Paraffin-Embedded; VST = Variance Stabilizing Transformation (using the R package DESeq2); RMA = Normalization and probe set summarization was performed using the Robust Multi-Array average algorithm (Log2 transformed and quantile normalized); FPKM = Fragments Per Kilobase Million. FPKM were transformed to log space and quantile normalized; RPKM = Reads Per Kilobase Million. RPKM were transformed to log space and quantile normalized
Download datasets
ExpressionSet objects were created for each cohort. The data objects consist of the following three entities: the expression matrix exprs(), the phenotye data pData(), and the feature data fData(). The objects contain samples of primary tumors (see also column “note” in the table above). Data types of the expression data are described above (see also caption of the table). The expression matrices contain all ProstaTrend genes.
All studies have these clinical parameters pData() in common:
consensus = c(
  "SAMPLE_ID", "GSM_SAMPLE_ID", "SRR_SAMPLE_ID", "PAPER_SAMPLE_ID", "SAMPLE_COUNT",
  "AGE", "STUDY", "PLATFORM", "TISSUE", "SAMPLE_CLASS", "SAMPLE_TYPE", "SURGICAL_PROCEDURE",
  "CLIN_TNM_STAGE", "CLIN_T_STAGE", "CLIN_T_STAGE_GROUP", "CLIN_N_STAGE", "CLIN_M_STAGE",
  "PATH_TNM_STAGE", "PATH_T_STAGE", "PATH_T_STAGE_GROUP", "PATH_N_STAGE", "PATH_M_STAGE",
  "GLEASON_SCORE", "GLEASON_SCORE_1", "GLEASON_SCORE_2",
  "PRE_OPERATIVE_PSA", "MONTH_TO_BCR","BCR_STATUS", "MONTH_TO_LAST_FOLLOW_UP", "OS_STATUS",
  "MONTH_TO_DOD", "DOD_STATUS", "MONTH_TO_CEP", "CEP_STATUS"
)
- If a consensus parameter was missing in any of the studies, the values were replaced with
NA. The clinical data consists of the consensus parameters and the original metadata. - Some consensus parameters have been simplified. For example, in the CamCap_2016_Ross_Adams cohort , there are the following GLEASON_GRADE values: 7, 10, “NE”, “SMALL CELL” 9, “UNGRADED”, etc.. All non-integers were replaced by NA. However, the information is present in the original metadata (which is concatenated).
- “.+DOD” means death from disease. “.+CEP” means month to consensus endpoint (BCR or death from disease, depending on the cohort).
ProstaTrend Meta-Analysis
The development of the (revised) ProstaTrend signature is described in the main publication. For an overview of the cohorts used for the meta-analysis, see “Datasets.” All pre-processing stept are described in the main publication. We included all ProstaTrend genes annotated with an Ensembl ID and present in at least 2 cohorts in the meta-analysis. For each gene, a univariate Cox-regression model was applied to standardized expression values in log-space for each cohort individually. For the ProstaTrend training cohorts [1], it should be noted that due to a matched study design, patients from FF_seq_RP were included in FF_array_RP. Therefore, we used a weighted Cox-regression with weights 1/N, where N is the number of samples for the specific patient included across the two cohorts. Similarly, 40 patients are included in both the CancerMap_2017_Luca and CamCap_2016_Ross_Adams cohorts. However, since these patients are not identifiable, no adjustment could be made for these duplicates. Given the small number of duplicate patients and the large number of cases (n= 1821), the effects of higher weights for matched samples are negligible. Using the log hazard ratio values and the respective standard errors calculated from the coxph function, we estimated a combined effect size for each gene. We used a random effects model because we did not assume that there is one true effect size, which is shared by all the included cohorts, but rather a range of true effect sizes with additional sources of variation, such as different platforms (RNA-Seq and microarray), clinical or demographic variables, etc. The model was fitted with the restricted maximum-likelihood estimator using the R package meta. We declared that a prognostic gene from the (revised) ProstaTrend signature had a significant combined effect size when the FDR adjusted p-value (Benjamini-Hochberg method) was <0.05.
TCGA/GTEx
RNA-Seq data from the the Cancer Genome Atlas Project (TCGA) were downloaded using the recount2 database [2]. For this, we used the download_study('TCGA', type = 'rse-gene') function implemented in the R/Bioconductor package recount [3] to obtain gene feature-level count matrices. RNA-Seq data from human tissues of the Genotype-Tissue Expression (GTEx) project [4] were downloaded using the command download_study('SRP012682', type = 'rse-gene'). Transcripts per million (TPM) normalized gene expression values were extracted using the getTPM function. For TCGA cox proportional hazards models were performed for continuous standardized gene expression (in log-space) values of the ProstaTrend signature in a univariate regression model using the coxph function from the survival package. Analysis was performed using samples from primary tumors. Significance was adjusted for multiple testing using the Benamini-Hochberg method. The primary endpoint, with the exception of PRAD, was death from disease. For PRAD, biochemical relapse was used as the primary endpoint.
PCa cell atlas
Raw read counts from scRNA-Seq data of 5 studies were downloaded from NCBI GEO. This included the studies Chen et al. (GSE141445, [5]), Dong et al. (GSE137829, [6]), Ma et al. (GSE157703, [7]) and Song et al. (GSE176031, [8]). Read counts from the study Tuong et al. [9] were obtained from https://www.prostatecellatlas.org. We excluded one sample from the study by Chen et al. because it was a biopsy of a lymph node metastasis that cannot be directly compared with primary tumor. Pre-processing, integration, clustering, quality control, cell cluster annotation, estimation of copy number variations (CNVs) and differential gene expression analysis (DGEA) are described in Additional File 1 of the main publication. Using the study-wise standardized, normalized expression values of the scRNA-Seq datasets, we applied for each cell a simplified ProstaTrend Transcriptomc risk score, which was the mean of all genes at increased risk minus the mean of genes at reduced risk. The simplification of the score was necessary due to the low expression levels and high drop-out rate of individual genes in the scRNA-Seq data, which makes the transferability of the weights from the bulk analyses not robust.
[1] Kreuz M, Otto DJ, Fuessel S, et al. ProstaTrend-A Multivariable Prognostic RNA Expression Score for Aggressive Prostate Cancer. Eur Urol. 2020;78(3):452-459. doi:10.1016/j.eururo.2020.06.001
[2] Collado-Torres L, Nellore A, Kammers K, et al. Reproducible RNA-seq analysis using recount2. Nat Biotechnol. 2017;35(4):319-321. doi:10.1038/nbt.3838
[3] Collado-Torres L, Nellore A, Jaffe AE. recount workflow: Accessing over 70,000 human RNA-seq samples with Bioconductor. F1000Res. 2017;6:1558. Published 2017 Aug 24. doi:10.12688/f1000research.12223.1
[4] Carithers LJ, Moore HM. The Genotype-Tissue Expression (GTEx) Project. Biopreserv Biobank. 2015;13(5):307-308. doi:10.1089/bio.2015.29031.hmm
[5] Chen, S. et al. Single-cell analysis reveals transcriptomic remodellings in distinct cell types that contribute to human prostate cancer progression. Nat Cell Biol 23, 87–98 (2021)
[6] Dong, B. et al. Single-cell analysis supports a luminal-neuroendocrine transdifferentiation in human prostate cancer. Communications Biology 3, 778 (2020)
[7] Ma, X. et al. Identification of a distinct luminal subgroup diagnosing and stratifying early stage prostate cancer by tissue-based single-cell RNA sequencing. Molecular Cancer 19, 147 (2020)
[8] Song, H. et al. Single-cell analysis of human primary prostate cancer reveals the heterogeneity of tumor-associated epithelial cell states. Nat Commun 13, 141 (2022)
[9] Tuong, Z. K. et al. Resolving the immune landscape of human prostate at a single-cell level in health and cancer. Cell Reports 37, 110132 (2021)
The y-axis depicts the expression of the selected gene.
The y-axis depicts the continuous cell annotation
This website was developed with a modified version of ShinyCell